
OK, here’s a little taste of what I usually do, rather than some random ramblings… I have a PhD student who is running enzyme-linked immunosorbent assays, or “ELISAs” to the initiated. This is a standard technique for measuring (in a semi-quantitative way) the amount of a given substance in a sample. Basically (and this is a pretty basic description), you stick an antigen to a surface (like the bottom of a plastic tray) and then add an antibody that sticks to the antigen. The antibody has an enzyme stuck to it and when you add the substance of interest the enzyme catalyses a reaction that causes a change in the intensity of a colour. You can shine a light through the sample to see how much the colour has changed and that gives you an idea about the concentration of your sample.Read More »
Category: R
A hat-full of academic how-tos
Dipping in and out of the stream of tweets, there are always fascinating links to excellent resources for academics at all stages of their careers. I just spotted another, and thought it might be about time to aggregate some of these for posterity. Here’s the quick list (to which I will add if people suggest links), and details are below
- “How to find a postdoc”
- “How to get started with R”
- “How to use Github and RStudio”
- “How to use Github effectively”
- “How to respond to reviewers’ comments”
- “How to write a literature review”
- “How to help fight sexism in academia”
- “How to make your publications more accessible”
- “How to make your work reproducible”
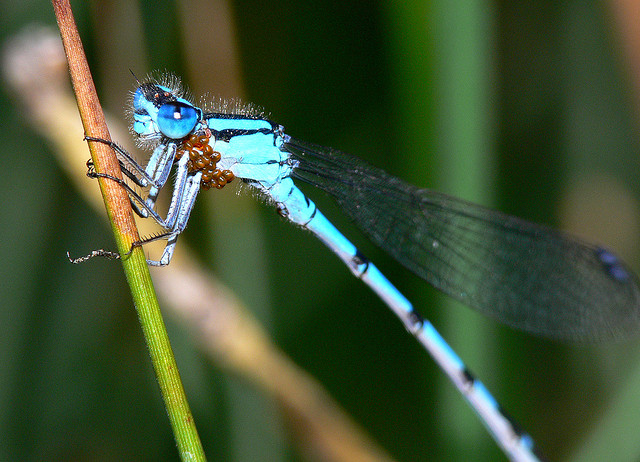
Damselflies change shape as they move north
 Background: It has been proposed that animals and plants of the same species vary in their shape and size depending on where they live. Individuals living close to the cooler, northern range boundary might possess traits that increase their ability to deal with cooler temperatures, for example. However, under climate change the places where animals can live are expected to move as warmer temperatures expand the areas where climate is suitable for different species.
What we did: This study was part of my doctoral research and compared populations of three species between their range core and their range margins. The three species varied in the degree to which they were expanding their ranges under climate change: Pyrrhosoma nymphula (the large red damselfly) is not expanding in the UK and is found all the way to the northern coast of Scotland, Erythromma najas (the red-eyed damselfly) is found as far north as Cheshire and is not expanding its range margin, and Calopteryx splendens (the banded demoiselle) is found as far north as Northumbria and is expanding rapidly. The results showed that there was greater variation between the core and range margins in C. splendens, the species which was expanding, less difference in E. najas which is barely expanding, and almost no difference in P. nymphula, which has expanded its range as far as it can.
Importance: In order to respond to climate change, species will likely need to shift their geographical ranges. This involves being able to colonise new habitats which are currently outside of their range. The detection of variation in morphology such as in this study suggests that there might be traits that would facilitate this colonisation at range margins. If it could be demonstrated that the variation in morphology was evolutionary and not the result of phenotypic plasticity, then this would provide important evidence of adaptation to coping with climate change.
This is part of a series of short lay summaries that describe the technical publications I have authored. This paper, entitled “Variation in morphology between core and marginal populations of three British damselflies”, was published in the journal Aquatic Insects in 2009. You can find this paper online at the publisher, or on Figshare.
Image credit: Jean-Daniel Echenard, CC BY-ND 2.0, http://bit.ly/1AHimY5
Blood-sucking mites are worse in mid-summer for damselflies
 Background: Parasites drain resources from their hosts in order to survive and reproduce. The effects that this has on the host have been shown to be substantial in some species of dragonfly and damselfly. However, in order to assess how serious these effects are, we need to know something about patterns of parasitism: how many parasites does an animal carry and how does that number vary throughout the year?
What we did: We had a two year study looking at a single population of the azure damselfly, Coenagrion puella, at a single site in southern England. All the damselflies (1036 in total) emerging from the pond were caught, marked individually, and the number of parasitic mites that were clinging to them were counted. Technically these mites don’t suck blood, but they do feed on the “haemolymph” of the insects, which is the insect equivalent. We had a number of hypotheses as to what might drive variations in parasitism: higher temperatures might increase the effectiveness of mites at finding and latching-on to hosts, larger animals might have more parasites, or there might be a difference between sexes in parasitism. We found that most of the variation in parasitism was related to the animals emerging in the middle of the season having the most parasites, while animals emerging early or late had fewer parasites.
Importance: The seasonal pattern suggests that variation in parasitism is the result of ecological interactions where parasites have evolved to take advantage of their hosts’ patterns of development. Given that dragonflies and damselflies have been shown to be emerging at different times in response to climate change, it remains to be seen whether mites will be able to track these changes.
This is part of a series of short lay summaries that describe the technical publications I have authored. This paper, entitled “Phenology determines seasonal variation in ectoparasite loads in a natural insect population”, was published in the journal Ecological Entomology in 2010. You can find this paper online at the publisher, or on Figshare.
Image credit: Brad Smith, CC BY-NC 2.0, http://bit.ly/1q6YTeA
Online computer programming courses
Computer programming is becoming an increasingly important part of biology (my own discipline) and a range of other subjects. Programming allows the analysis of data, the creation of software and the building of online resources and interfaces. There are a range of online courses that you can take to develop these skills, and use as teaching aids for students, that cover a lot of different languages with different applications:

Codeschool offers four key “paths” composed of sets of modules in different programming environments: Ruby and JavaScript (two different methods for online application building), HTML/CSS (web design), and iOS (for Apple apps). However, they also offer “electives” alongside the main paths, looking at R (an open source programming language), Git (a method for version control in the development of programming), and Chrome Developer Tools (for apps in the Chrome browser).

Codecademy, much like Codeschool, offers a wide range of programming languages. However, all courses through Codecademy are free of charge. The focus is on web programming using HTML, CSS and JavaScript, and application building using Ruby, APIs, and Python. Codecademy also allows people to generate their own courses, meaning that there are many smaller sets of tutorials designed to teach specific principles.
An Example of Use
CodeSchool runs a course called “Try R“, which offers a few hours of interactive training in the R environment. For those of you not familiar with theR language, R is an open source programming language that is mostly built around data manipulation and analysis. The course itself loads within the website, with a simulated R environment within which the student can work. The content covered includes: syntax, vectors, matrices, summary statistics, factors, data frames, and “working with real-world data”. At Leeds we teach our MSc Biodiversity and Conservation students in R for a short period, but this is the kind of tool that the students can use to familiarise themselves more completely with the language. It could also be a gentle introduction to some of the R-based MOOCs that are run by Coursera.
I did a map!
I have been playing with R’s capacity to produce interactive maps and (after much trial-and-error) have finally come up with something that shows an interesting pattern. The data plotted below are the species richness of dragonflies and damselflies from the British Dragonfly Society‘s database in West Yorkshire over the last 20 years. The data are summarised to 1km grid squares on the British National Grid. Below is a screenshot because WordPress doesn’t like iframes, but click it to go to the full map.

The scale is a bit odd to emphasise the range of the data, and there are many neater ways to do this. In particular, R gives the option to render in interactive 3D using OpenGL, create actual interactive maps using Shiny, and use the Leaflet jscript packages. There are more details on the plotGoogleMaps package that I used for this little map here. The code is below:
Dragonfly.grid <- read.table("Dragonfly data.txt",header=TRUE)
attach(Dragonfly.grid)
Dragonfly.grid[,2]<-Dragonfly.grid[,2]*100
Dragonfly.grid[,3]<-Dragonfly.grid[,3]*100
library(RColorBrewer)
coordinates(Dragonfly.grid)<-c('Easting','Northing')
Dragonfly.grid<-as(Dragonfly.grid,'SpatialPixelsDataFrame')
proj4string(Dragonfly.grid) <- CRS('+proj=tmerc +lat_0=49 +lon_0=-2 +k=0.9996012717 +x_0=400000 +y_0=-100000 +ellps=airy +datum=OSGB36 +units=m +no_defs')
m=plotGoogleMaps(Dragonfly.grid,zcol='Species',at=c(0,2,3,4,6,8,12,21),colPalette= rev(rainbow(7,start=0,end=4/6)))
Using R to look at engagement with Twitter at scientific conferences
 I have been busy attending conferences recently (one of many excuses for not updating the blog) and I thought I would mention one significant difference between these conferences and those that I have attended previously. At Behaviour 2013 (Newcastle, 4-8 Aug 2013 – that’s me talking about mimicry on the right), I tried live-tweeting for the first time. Then at Intecol 2013 (London, 18-23 Aug 2013) almost all questions during the plenary talks were taken solely by Twitter. This meant that I had a lot more experience of Twitter in an academic forum that I had had before, and I found it to be an immensely positive experience! Not only did people come up and say “hi” because they recognised my name from Twitter (new networking opportunities), but I passively participated in multiple parallel sessions where usually I would only have had access to the session within which I was physically present (there were 16 parallel sessions at any one time at Intecol!).Read More »
